ZAP JavaScript Engine Memory Leak Issue Impacts Active Scan Usage
ZAP JavaScript Engine Memory Leak Undermines Active Scanning Capabilities
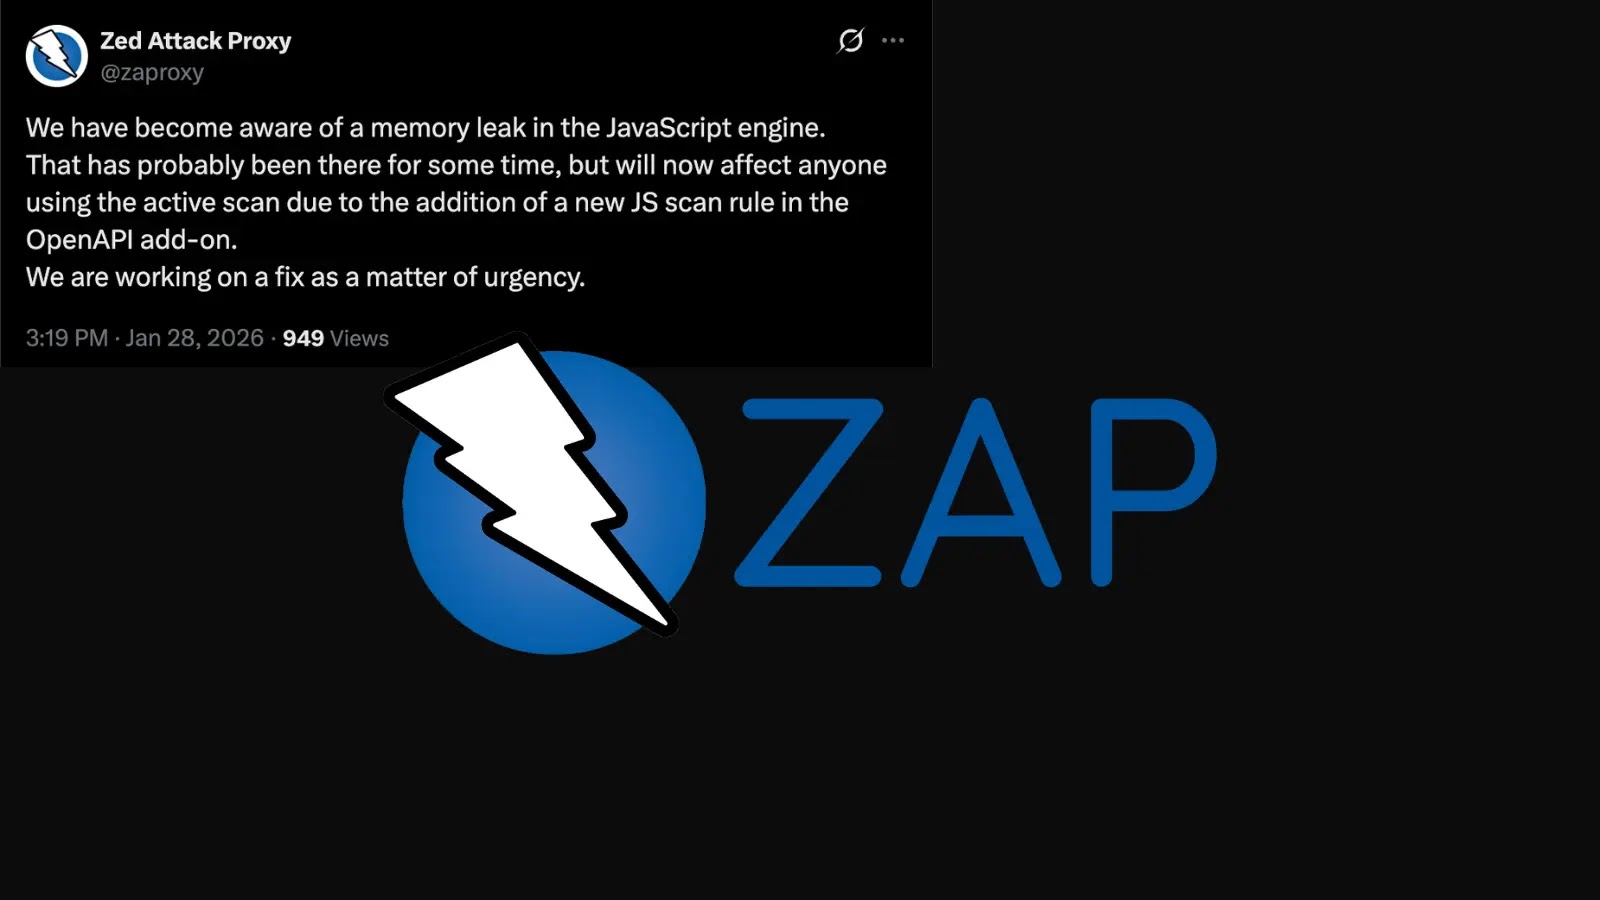
The Zed Attack Proxy (ZAP) project, a cornerstone open-source web application security scanner, has recently brought to light a significant memory leak within its JavaScript engine. While likely present for some time, this flaw has now escalated into a critical concern, directly impacting active scanning workflows. The trigger for this increased disruption is the recent introduction of a new JavaScript scan rule within the OpenAPI add-on. For security teams and developers who depend heavily on ZAP for comprehensive web application assessments, this ZAP memory leak issue presents a considerable operational challenge.
Understanding the ZAP Memory Leak
The core of the problem lies within ZAP’s JavaScript engine, which is integral to several of its dynamic analysis capabilities. Memory leaks occur when a program fails to release memory that it no longer needs, leading to a gradual accumulation of unused memory. Over time, this can exhaust available system resources, causing performance degradation, application instability, and eventually, crashes. In the context of ZAP, this leak has been exacerbated by a specific update:
- OpenAPI Add-on Impact: The recent inclusion of a new JavaScript-based scan rule in the OpenAPI add-on is identified as the primary catalyst. This rule, designed to enhance ZAP’s ability to analyze and test APIs defined by the OpenAPI specification, inadvertently triggers the existing memory leak more aggressively.
- Active Scan Usage: The most significant operational impact is felt during active scanning. Active scans involve ZAP actively probing the target application for vulnerabilities, often requiring extensive use of its scripting and dynamic analysis features. The memory leak causes ZAP to consume increasing amounts of RAM during these scans, ultimately leading to performance bottlenecks and potential crashes, especially during long-running or complex assessments.
Operational Ramifications for Security Teams
The implications of this ZAP JavaScript engine memory leak are substantial for organizations and individuals leveraging ZAP:
- Reduced Scan Efficiency: Active scans are now prone to premature termination or significant slowdowns, directly impacting the speed and thoroughness of web application security scanning.
- Resource Exhaustion: ZAP instances may consume excessive system resources, necessitating frequent restarts or dedicated high-memory environments, increasing operational overhead.
- Disrupted Workflows: Security teams relying on ZAP for continuous integration/continuous deployment (CI/CD) pipelines or regular penetration testing may experience disruptions, potentially delaying security assessments and releases.
- Incomplete Vulnerability Coverage: Crashes or performance issues during scans can lead to incomplete vulnerability discovery, leaving potential security gaps unaddressed.
Remediation Actions and Mitigations
Addressing the ZAP memory leak issue is crucial for maintaining effective web application security testing. While a permanent fix from the ZAP project is the ultimate solution, several immediate steps can be taken:
- Update ZAP and Add-ons: Always ensure your ZAP installation and all its add-ons are updated to the latest stable versions. The ZAP development team is actively working on fixes, and updates will likely contain improvements.
- Disable or Isolate the OpenAPI JavaScript Rule: If possible within your testing methodology, temporarily disable the specific JavaScript scan rule within the OpenAPI add-on that is causing the heightened memory consumption. This might be a temporary workaround until a patch is released. Refer to ZAP’s documentation or community forums for specific instructions on managing individual scan rules.
- Monitor ZAP’s Memory Usage: Implement monitoring tools to track ZAP’s memory consumption during active scans. This can help identify when the leak is becoming critical and when a restart might be necessary.
- Segment Active Scans: For very large or complex applications, consider breaking down active scans into smaller, more manageable segments. This reduces the consecutive runtime during which the memory leak can accumulate, allowing for intermediate restarts.
- Increase System Resources: As a temporary measure, allocating more RAM to the machine running ZAP can defer the impact of the memory leak, though this is not a long-term solution.
- Follow ZAP Project Announcements: Stay informed by regularly checking the official ZAP project website, GitHub repository, and community forums for official patch releases and guidance.
Tools for Web Application Security and ZAP Management
To effectively manage ZAP usage and related security testing, a range of tools can be beneficial:
| Tool Name | Purpose | Link |
|---|---|---|
| OWASP ZAP | Main web application security scanner affected by the leak. | https://www.zaproxy.org/ |
| Docker (for ZAP deployment) | Containerization for easier ZAP deployment, isolation, and resource management. | https://www.docker.com/ |
| Prometheus & Grafana | System and application performance monitoring, including memory usage of ZAP processes. | https://prometheus.io/ https://grafana.com/ |
| Jira/Trello | Tracking and managing security tasks, including ZAP scan results and issues. | https://www.atlassian.com/software/jira https://trello.com/ |
Conclusion
The ZAP JavaScript engine memory leak, particularly exacerbated by the new OpenAPI add-on rule, underscores the constant need for vigilance in cybersecurity tools. While ZAP remains an invaluable asset for web application security testing, understanding and mitigating this specific issue is vital for maintaining robust security postures. By staying informed, implementing temporary workarounds, and actively following the ZAP project’s development, security teams can navigate this challenge and continue to leverage ZAP’s powerful capabilities effectively.


