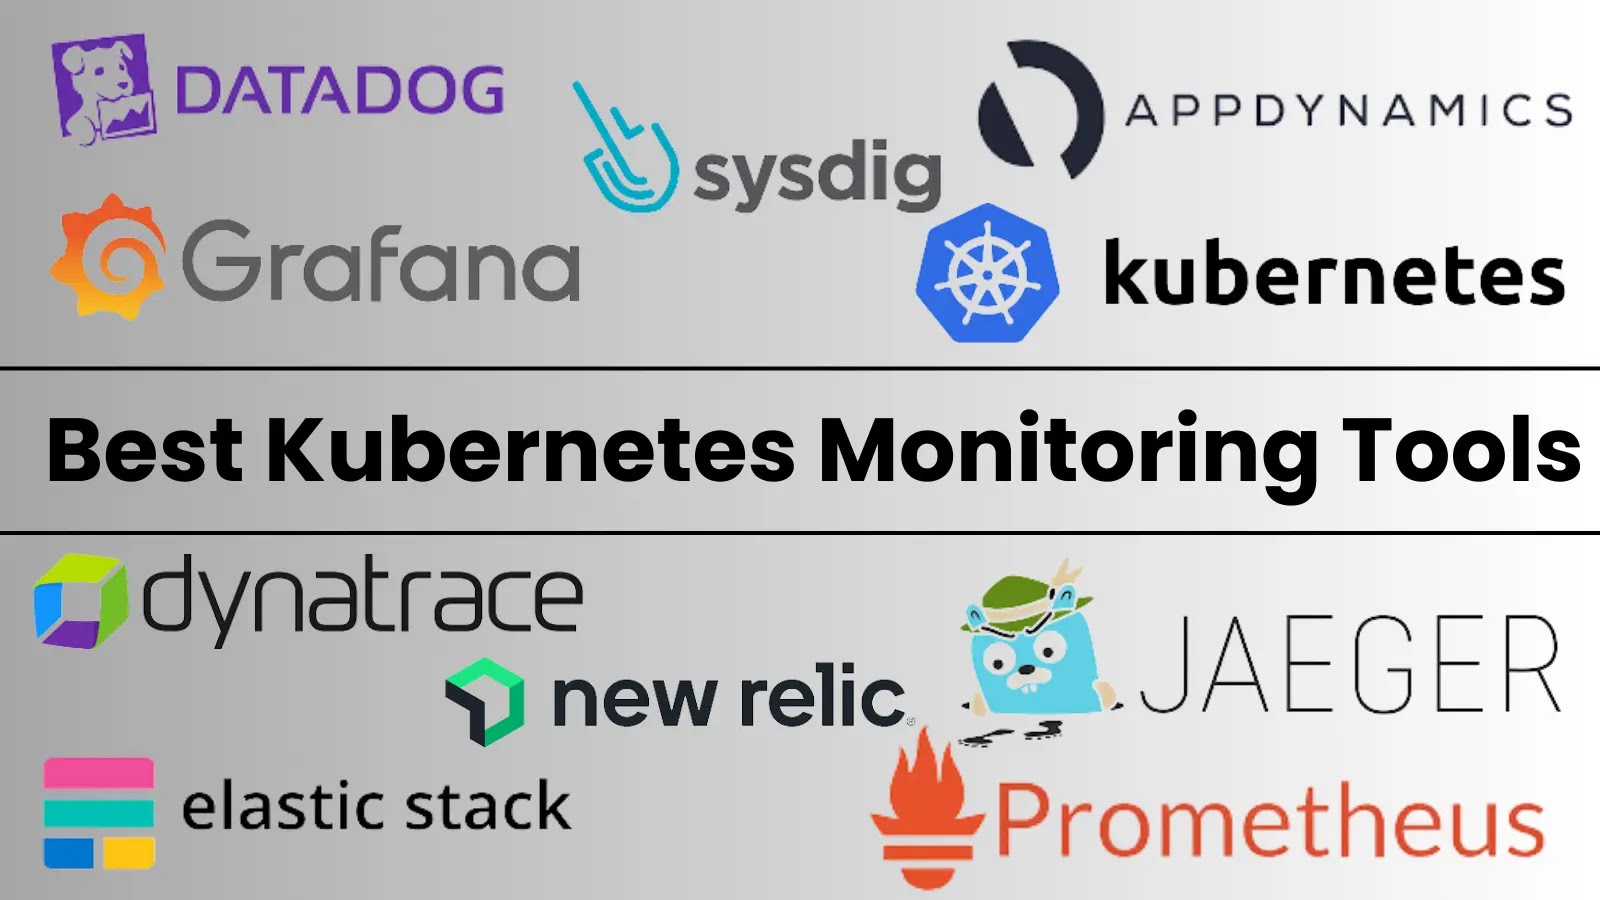
20 Best Kubernetes Monitoring Tools in 2025
Unveiling the Criticality of Kubernetes Monitoring in 2025
In the complex landscape of modern cloud-native applications, Kubernetes has emerged as the definitive standard for container orchestration. Yet, the power and flexibility of Kubernetes come with inherent operational complexities. Maintaining the health, performance, and unwavering reliability of these dynamic clusters, their nodes, and the multitude of pods they manage is paramount for any organization. Without clear, real-time visibility, identifying and swiftly resolving issues becomes a daunting, if not impossible, task.
This challenge underscores the critical role of robust Kubernetes monitoring tools. These solutions act as the eyes and ears of your infrastructure, providing granular metrics on resource utilization (CPU, memory, storage), network performance, application-level insights, and potential security anomalies. By proactively detecting bottlenecks, resource contention, and anomalous behavior, IT professionals can optimize resource allocation, ensure application uptime, and significantly reduce mean time to resolution (MTTR) for incidents.
The Evolution of Kubernetes Monitoring Needs
As Kubernetes deployments scale and integrate with increasingly intricate microservices architectures, the demands on monitoring tools intensify. Beyond basic resource metrics, the focus has shifted towards intelligent alerting, distributed tracing, log aggregation, and even predictive analytics. Organizations require solutions that can not only tell them “what happened” but also “why it happened” and “what’s likely to happen next.” The ability to correlate various data points — from infrastructure to application logs — is no longer a luxury but a fundamental requirement for comprehensive operational intelligence.
Key Metrics and What They Tell You
Effective Kubernetes monitoring revolves around a core set of metrics that provide a holistic view of your cluster’s health. Understanding these metrics is crucial for diagnosing issues and optimizing performance:
- CPU Utilization: Indicates how much processing power is being consumed by nodes and pods. High utilization can signal bottlenecks.
- Memory Usage: Tracks the amount of RAM consumed. Excessive memory use can lead to OOMKilled (Out Of Memory Killed) errors, impacting application stability.
- Disk I/O: Measures read/write operations to storage. Slow disk I/O can degrade application performance, especially for data-intensive workloads.
- Network Throughput & Latency: Essential for understanding inter-service communication and external connectivity. High latency or low throughput can pinpoint network issues.
- Pod Status & Restarts: Frequent pod restarts often indicate underlying issues like misconfigurations, resource starvation, or application errors.
- Node Health: Monitors the status of individual nodes within the cluster, including CPU, memory, and disk capacity.
- API Server Latency: Critical for understanding the responsiveness of the Kubernetes control plane.
- Container Logs: Provides detailed insights into application behavior, errors, and warnings.
Top Kubernetes Monitoring Tools for 2025
While the original source hinted at a list of 20 tools, a comprehensive analysis of the evolving Kubernetes ecosystem and market trends indicates several standouts that consistently deliver value. These tools offer varying specialties, from open-source flexibility to enterprise-grade comprehensive suites.
Prometheus & Grafana (Open Source Powerhouses)
This combination remains the de facto standard for open-source Kubernetes monitoring. Prometheus excels at collecting time-series data via a pull model, making it exceptionally good at scraping metrics from applications, nodes, and the Kubernetes API. Grafana then provides powerful, customizable dashboards for visualizing this data, offering alerting capabilities and a wide array of plugins.
- Purpose: Metrics collection, querying, alerting (Prometheus); Data visualization, dashboarding, advanced alerting (Grafana).
- Strengths: Highly flexible, vast community support, extensive integrations, cost-effective for self-hosting.
Datadog (Cloud-Native Observability Platform)
Datadog offers a comprehensive, SaaS-based observability platform that covers infrastructure monitoring, application performance monitoring (APM), log management, and security monitoring, all with deep Kubernetes integration. Its unified platform simplifies data correlation.
- Purpose: End-to-end observability (metrics, logs, traces, security) for Kubernetes and beyond.
- Strengths: Unified platform, rich visualization, AI-driven alerting, active community.
Dynatrace (AI-Powered Observability)
Dynatrace focuses on AI-powered automatic and intelligent observability for cloud-native environments, including Kubernetes. Its OneAgent technology automatically discovers and maps dependencies, providing root-cause analysis.
- Purpose: Full-stack observability with automated root-cause analysis through AI.
- Strengths: Automatic discovery, AI-driven insights, deep application-level tracing.
New Relic (Developer-Centric Observability)
New Relic provides an observability platform designed to give developers and operations teams a unified view of their entire software stack. It offers robust Kubernetes monitoring, APM, infrastructure monitoring, and error tracking.
- Purpose: Comprehensive observability with a strong focus on developer experience and application performance.
- Strengths: Unified UI, strong APM capabilities, extensive integrations.
Splunk (Log Management and Observability)
While historically known for log management, Splunk has significantly expanded its offerings to include comprehensive observability for Kubernetes. Its power lies in its ability to ingest, index, and analyze vast amounts of machine data, including Kubernetes logs and metrics.
- Purpose: Advanced log management, security information and event management (SIEM), and observability for complex environments.
- Strengths: Powerful search and analysis capabilities, enterprise-grade scalability.
Instana (Automated & Context-Rich Observability)
Instana provides automated, real-time APM and full-stack observability for cloud-native applications, including Kubernetes. It automatically discovers and maps all service dependencies and traces every request.
- Purpose: Automated, real-time observability with a focus on deep dependency mapping and tracing.
- Strengths: Zero-configuration setup, highly automated, excellent for microservices.
Kube-state-metrics (Kubernetes-Native Metrics)
Kube-state-metrics is an open-source project that listens to the Kubernetes API server and generates metrics about the state of Kubernetes objects (e.g., deployments, pods, nodes). It’s often used in conjunction with Prometheus.
- Purpose: Expose raw Kubernetes object state as metrics.
- Strengths: Provides core Kubernetes-native metrics, highly reliable, easy to integrate.
Logz.io (ELK-Stack as a Service)
Logz.io offers a cloud-native observability platform built on open-source tools like Elasticsearch, Logstash, Kibana (ELK Stack), and Prometheus. It simplifies log and metrics management with AI-driven insights.
- Purpose: Managed ELK and Prometheus services with added AI capabilities for log and metric analysis.
- Strengths: Leverages popular open-source tools, simplified operations, anomaly detection.
Sumo Logic (Cloud SIEM & Observability)
Sumo Logic provides a cloud-native logging and analytics platform that has evolved into a comprehensive observability solution. It offers robust capabilities for security analytics (SIEM) alongside operational intelligence for Kubernetes.
- Purpose: Log management, security analytics, and observability for cloud environments.
- Strengths: Strong security features, powerful analytics engine, scalable.
Remediation Actions for Monitoring Deficiencies
Effective monitoring isn’t just about identifying problems; it’s about enabling swift remediation. When monitoring reveals an issue, the following actions can be taken:
- Resource Scaling: If high CPU or memory utilization is detected (e.g., through metrics like
node_cpu_seconds_totalorcontainer_memory_usage_bytes), consider adjusting resource requests/limits in pod definitions or enabling Horizontal Pod Autoscalers (HPAs) or Cluster Autoscalers. - Log Analysis: For application errors (signified by frequent pod restarts or error logs), dive deep into container logs to identify the root cause. Tools like Grafana Loki or centralized log management systems make this process efficient.
- Network Troubleshooting: High network latency or dropped packets can point to CNI (Container Network Interface) issues or external network problems. Verify network policies, CNI plugin health, and connectivity to external services.
- Security Incident Response: Anomalous behavior detected by security aspects of monitoring tools (e.g., unusual network traffic patterns, unauthorized API calls) should trigger immediate incident response protocols. For example, if CVE-2022-31792 (Improper Access Control in Kubernetes API server) was leveraged, monitoring might show unusual API call patterns; remediation involves patching and reviewing RBAC policies.
- Configuration Review: Persistent issues might stem from misconfigurations in Kubernetes manifests (Deployments, Services, ConfigMaps). Comprehensive GitOps practices with monitoring integrations can help track and revert problematic changes.
- Alert Fine-Tuning: Regular review and fine-tuning of alerting rules prevent alert fatigue and ensure critical issues are escalated appropriately. Adjust thresholds based on historical performance and business impact.
Conclusion
The operational success of Kubernetes environments in 2025 hinges on proactive and intelligent monitoring. The array of tools available—from powerful open-source combinations like Prometheus and Grafana to comprehensive commercial platforms like Datadog and Dynatrace—provides organizations with the necessary visibility to maintain high performance, ensure reliability, and bolster security. Choosing the right tool or combination of tools depends on specific organizational needs, scale, budget, and desired level of automation. Regardless of the choice, real-time insights into cluster health, resource utilization, and application behavior are non-negotiable for anyone managing production Kubernetes workloads.


